
Dev Tools
Console and Performance
What the Console logs about your runs and the app, how to filter it, and what the Performance tab measures.
The Console is the diary of the session: what Luvin loaded, saved and ran, with warnings and errors. The Performance tab tells you how much the app uses and how long each step takes. Open them in Dev Tools.
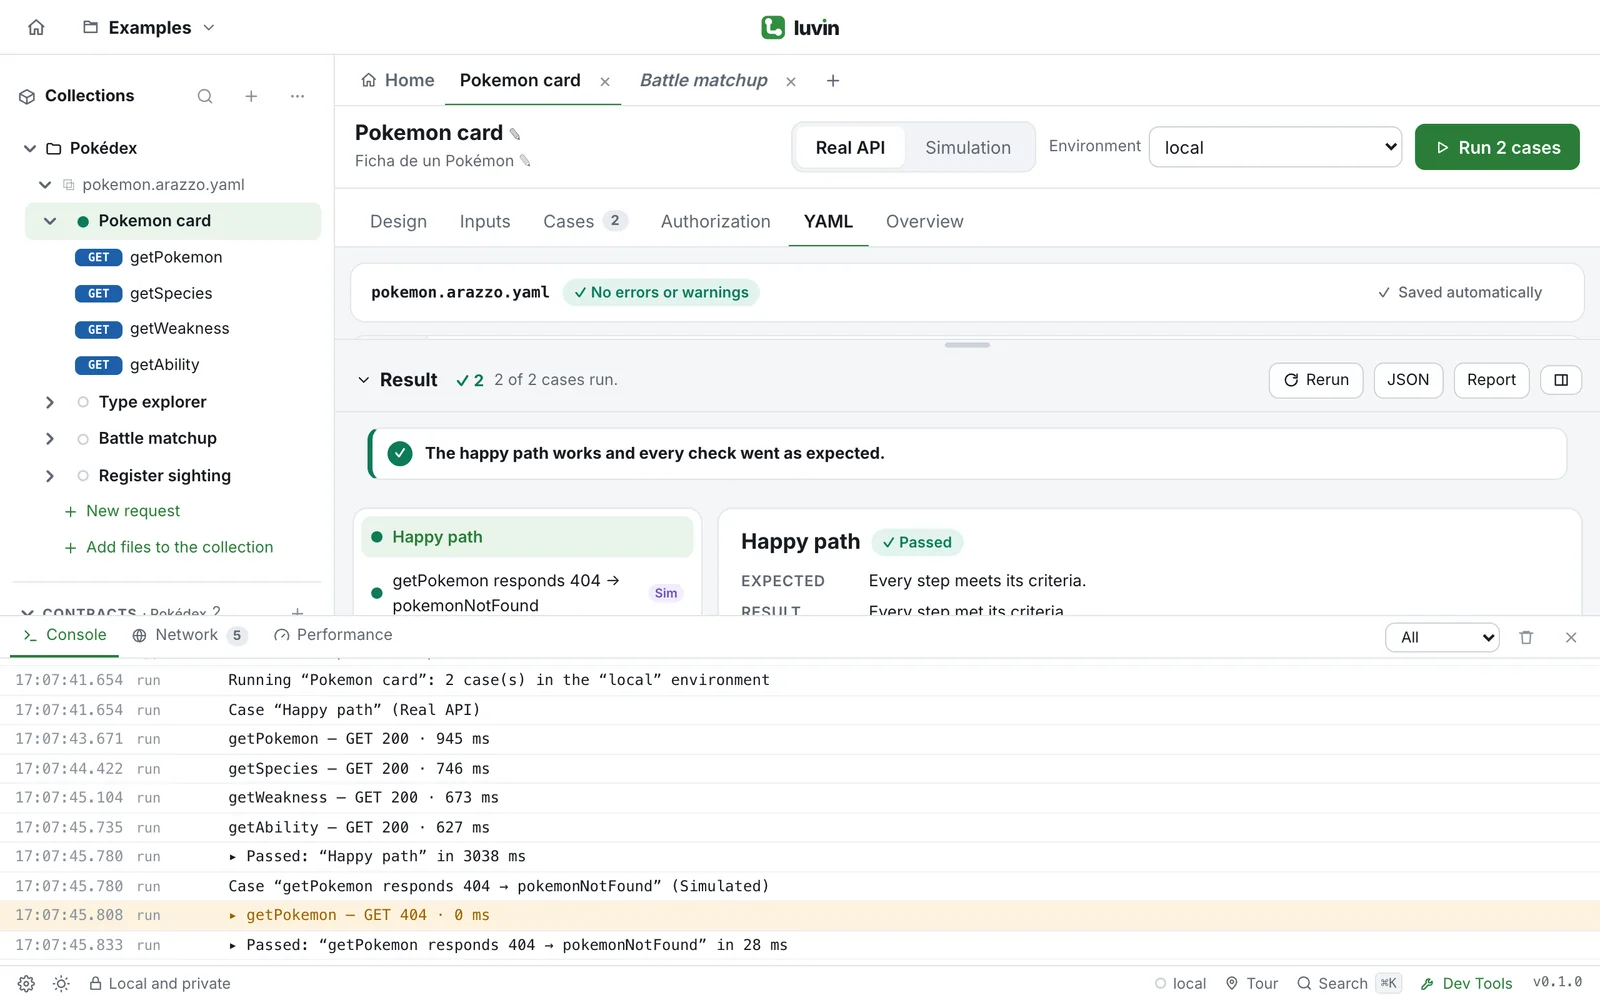
Example: the Console after a run
Section titled “Example: the Console after a run”Running “Pokemon card”: 3 case(s) in the “local” environmentCase “Happy path” (Real API)getPokemon — GET 200 · 143 msPassed: “Happy path” in 812 msOne line per event: the workflow, the case, each step with its status and time, and the verdict. A ▸ opens the detail.
Read the Console
Section titled “Read the Console”Each line has three parts:
| Part | What it shows |
|---|---|
| Time | The hour, minute, second and millisecond. |
| Source | run for runs, app for what the app does (loading, saving, importing) and js for unexpected program errors. |
| Message | The text. A line with a ▸ has more detail: click it to open ▾ the detail. |
Lines are colored by level: information, warning or error. The Console follows the newest line. If you scroll up to read, it stays where you are.
When there is nothing yet, the tab says No logs yet.
What a run writes
Section titled “What a run writes”A run writes these lines, in order:
Running “Pokemon card”: 3 case(s) in the “local” environment. The workflow, how many cases and the environment.- If the workflow depends on another one (
dependsOn):Preparing the workflow (dependsOn): typeExplorer → battleMatchup. - For each case:
Case “Happy path” (Real API). The mode is Real API or Simulated. - For each step:
getPokemon — GET 200 · 143 ms. For a message step:SEND pokedex.sighting.registered · 4 ms. A step with no response says whether it was passed, failed, skipped or with warnings. If a step calls another workflow, its steps follow. - When the case ends:
Passed: “Happy path” in 812 ms. - If you cancel:
Run cancelled.
A case that failed writes its line as an error. A case that ended with a warning or inconclusive writes a warning. A step that failed or finished with warnings writes a warning, not an error: in a negative case, a failing step is exactly what you expect, and the case decides if the result is wrong.
The detail of a line (click the ▸) holds the reason in plain words, the problems found against the contract and any value Luvin could not resolve.
What the app writes
Section titled “What the app writes”3 file(s) loadedwhen you open files, and one warning for each file that could not be read.Collection “payments” opened: 4 file(s), 2 environment(s)andWorkspace “My workspace” opened (…).Imported “Shop” (24 requests)after an import from Postman or Bruno.- An error,
Couldn’t save the workspace, with the reason in its detail, if saving fails. - An error with the method and URL when a request you sent from a saved request or Try it out gets no answer.
- Errors that nobody caught, with source
js.
Filter and clear
Section titled “Filter and clear”- Use the level selector to show All, Info, Warnings or Errors.
- Click Clear (the trash icon) to empty the Console.
The number in red on the Console tab, and on the Dev Tools button when the panel is closed, counts the errors. The Console keeps the last 500 lines and empties when you close the app.
The Performance tab
Section titled “The Performance tab”App resources
Section titled “App resources”| Card | Desktop app | Browser |
|---|---|---|
| CPU usage | Of the whole app. | Not available. |
| Memory | Of the whole app, with the number of processes. | JS memory, of this tab, in browsers that report it. |
| Uptime | Since the app opened. | Since the page opened. |
| PID | The main process. | Not available. |
The numbers refresh every two seconds. In the browser, the tab says that CPU, total memory and PID are only in the desktop app.
Time per step
Section titled “Time per step”The table Time per step in this session (real API) has one row per step, with the columns Step (with its method), Workflow, Calls, Average, Max and Failed. It is sorted from slowest to fastest by average.
- Run a workflow against the Real API.
- Open Performance.
- Read the first rows: they are the steps that take the longest.
A simulated run does not appear, because it makes no network call. Until you run something real, the tab says Run a workflow against the real API to see how long each step takes.